Dealership Analytics: Fueling Growth with Data-Driven Sales
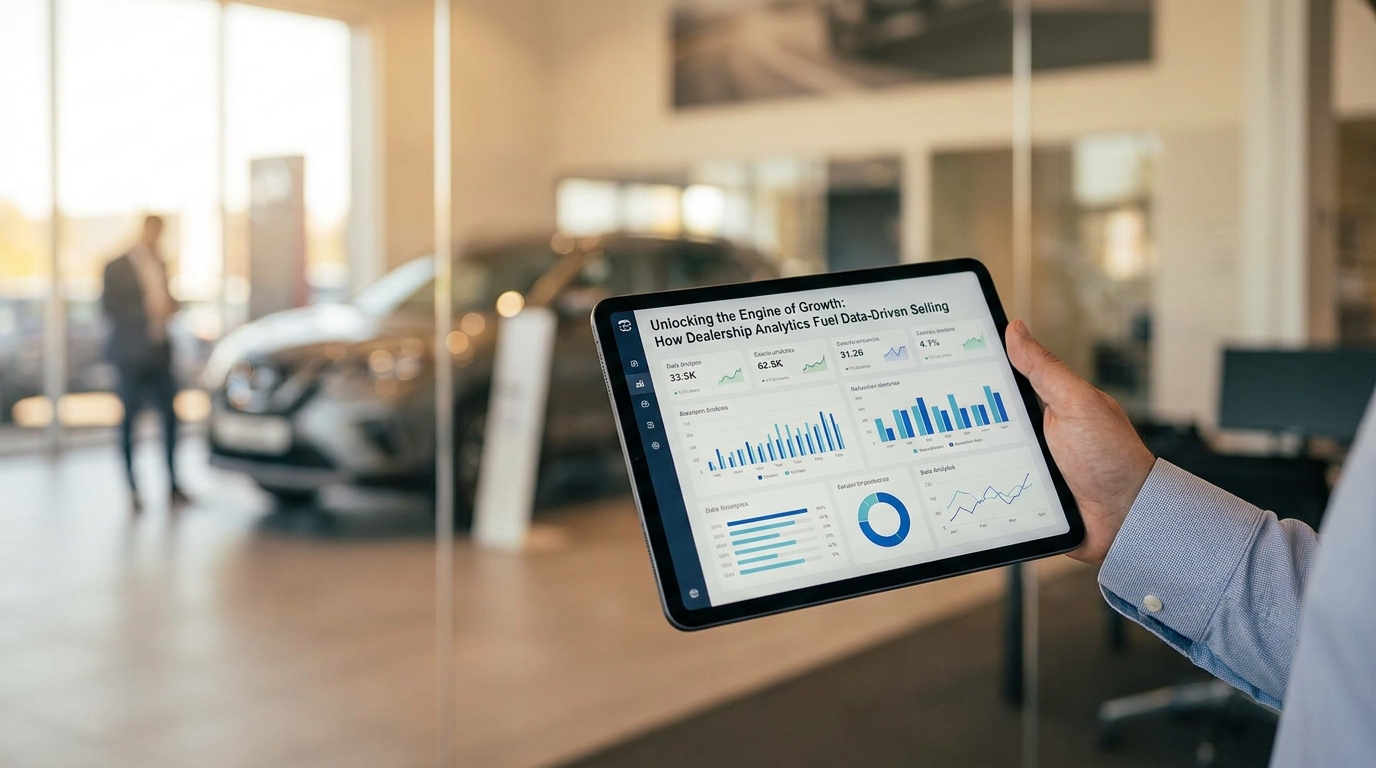
In the fast-paced world of automotive retail, the days of relying solely on gut instinct and a firm handshake are fading in the rearview mirror. While experience and salesmanship will always be crucial, the most successful modern dealerships are powered by a different kind of fuel: data. The shift from anecdotal evidence to actionable analytics is no longer a trend; it’s a fundamental change in how the business of selling cars is done. Dealership analytics is the practice of collecting, analyzing, and interpreting data from every corner of your operation—sales, marketing, service, and finance—to make smarter, more profitable decisions. It’s about understanding not just *what* is happening, but *why* it’s happening and *what* you should do next.
This comprehensive guide will serve as your roadmap to embracing data-driven selling. We will move beyond a superficial look at sales numbers and dive deep into the specific Key Performance Indicators (KPIs) that truly measure the health and efficiency of your dealership. We’ll explore how to track performance across your sales floor, your digital showroom, and even your service bays. Furthermore, we’ll identify the essential tools of the trade, from the CRM that acts as your customer data hub to the advanced business intelligence platforms that bring all the pieces together. By the end, you’ll have a clear understanding of how to build a culture of analytics that empowers your team, enhances the customer experience, and ultimately drives your bottom line forward into a new era of automotive success.
From the Sales Tower to the Dashboard: The Evolution of Dealership Management
For decades, the rhythm of a car dealership was dictated by the experience and intuition of its leaders. A sales manager, perched in their tower overlooking the showroom floor, could often “feel” the energy of the day. They knew their top performers, understood seasonal trends from memory, and made staffing and inventory decisions based on years of hard-won knowledge. This traditional model was built on relationships, personal judgment, and a keen sense of the local market. While effective in its time, this approach has inherent limitations in today’s hyper-competitive, digitally-driven landscape.
The modern customer journey is no longer linear. It begins online, often weeks or months before a customer ever sets foot on your lot. They arrive armed with pricing data, vehicle comparisons, and reviews. They expect a seamless, personalized, and efficient experience. A dealership operating on gut feeling alone cannot consistently meet these expectations. This is where data-driven decision-making comes in. Instead of guessing which marketing channels are working, you can precisely track cost-per-lead and cost-per-sale. Instead of assuming a salesperson is effective, you can analyze their closing ratio by lead source and vehicle type. This shift provides a level of clarity and predictability that was previously unimaginable. The benefits are profound: increased operational efficiency, more effective marketing spend, a highly personalized customer experience, improved employee performance, and, most importantly, sustainable profitability.
The Core Four: Foundational Sales KPIs You Must Monitor
Before you can optimize your sales process, you need a clear, objective way to measure it. While the number of units sold is the ultimate goal, it’s a lagging indicator. The KPIs below are leading indicators—metrics that provide an early look at the health of your sales pipeline and allow you to make adjustments in real-time. Mastering these four foundational metrics is the first step toward a truly data-driven sales floor.
Lead Response Time
In the digital age, speed is everything. Lead Response Time measures the average time it takes for your sales team or BDC to make the first meaningful contact with a new internet lead. Why is this so critical? Studies have consistently shown that the odds of making contact with a lead, and ultimately setting an appointment, decrease exponentially with each passing minute. A lead that is five minutes old is already becoming cold. A lead that is an hour old might as well be from last week. Aiming for a response time of under five minutes should be the standard. Tracking this KPI, often within your CRM, exposes weaknesses in your process. Is a salesperson taking too long? Is your lead routing system inefficient? Fixing this single metric can have an immediate and dramatic impact on your appointment set rate.
Appointment Set Rate & Show Rate
These two KPIs are inextricably linked and measure the effectiveness of your initial lead handling. The Appointment Set Rate is the percentage of leads that result in a confirmed appointment for a dealership visit. A low rate might indicate poor phone skills, a lack of follow-up, or uncompelling value propositions. The Show Rate is the percentage of those set appointments that actually arrive at the dealership. A significant drop-off between appointments set and shown points to issues in your confirmation process. Are you sending text and email reminders? Are you confirming the day before and the day of? Analyzing these two metrics together tells a complete story. For example, a salesperson with a high set rate but a low show rate might be setting weak, unconfirmed appointments just to hit a metric, while another with a slightly lower set rate but a near-perfect show rate is likely building more value and rapport during the initial contact.
Closing Ratio
This is the classic measure of a salesperson’s effectiveness: the percentage of customers they interact with on the lot who end up purchasing a vehicle. However, simply looking at an overall closing ratio is not enough. True analytics involves segmenting this data. What is the closing ratio for walk-in traffic versus internet appointments? How does it differ by lead source (e.g., your website vs. a third-party lead provider)? How does it vary between new and used cars, or even specific models? A low closing ratio on internet leads, for example, could signal a disconnect between your online pricing strategy and your in-store process. By digging into these details, you can pinpoint specific areas for training and process improvement, turning a simple metric into a powerful diagnostic tool.
Connecting Clicks to Keys: Digital Marketing and Website Analytics
Your dealership’s website is your digital showroom, and for most customers, it’s their first interaction with your brand. Understanding how users behave online is just as important as understanding how they behave on your lot. Digital marketing analytics bridge the gap between your online presence and your physical sales, allowing you to measure the true return on your marketing investment (ROI).
Key metrics here start with the basics like Website Traffic and Lead Sources. Using a tool like Google Analytics, you can see how many people are visiting your site and, crucially, where they are coming from—organic search, paid ads, social media, or referral sites. This tells you which channels are driving awareness. The next step is to measure the Conversion Rate, which is the percentage of those visitors who take a desired action, such as filling out a contact form, initiating a chat, or clicking to call. This metric tells you how effective your website is at turning browsers into leads. From there, you can calculate your Cost Per Lead (CPL) by dividing your ad spend for a specific channel by the number of leads it generated. The ultimate goal is to track this all the way to a sale, calculating your Cost Per Sale (CPS). Knowing you spent $500 on Facebook ads and sold two cars as a result gives you a tangible ROI that gut feeling can never provide. Finally, don’t ignore engagement metrics like Vehicle Detail Page (VDP) Views. A high number of views on a specific unit is a strong indicator of market demand and can inform your inventory and pricing strategy.
The Profit Center Powerhouse: Analytics for Your Service Lane
A dealership’s long-term stability and profitability are often built not on the showroom floor, but in the service bays. Fixed operations (service and parts) provide a consistent, high-margin revenue stream that can insulate the business from the volatility of vehicle sales. Applying a data-driven approach here is essential for maximizing this profit center.
Start with the fundamentals: Repair Order (RO) Count and the Average RO Value. These tell you how many customers you’re serving and how much they’re spending per visit. The goal is to consistently increase both. You should also analyze the mix of work being done by tracking Customer Pay vs. Warranty Work. A healthy service department has a strong percentage of customer-pay work, which carries much higher margins. A critical operational metric is the Service Absorption Rate. This powerful KPI calculates the percentage of your dealership’s total overhead expenses that are covered by the gross profit from your fixed operations. A rate of 100% or more means your service and parts department can pay all the dealership’s bills, even if you don’t sell a single car. Achieving this makes your business incredibly resilient. Finally, track your Customer Retention Rate. What percentage of customers who bought a car from you return to your service department? This is a key indicator of customer loyalty and a direct pipeline to future vehicle sales. A customer who trusts you with their service is far more likely to buy their next car from you.
The Dealership Analytics Toolkit: Essential Platforms and Software
Collecting and analyzing all this data is impossible without the right technology stack. A modern dealership runs on a handful of interconnected systems that, when used correctly, provide a 360-degree view of the business. Understanding the role of each tool is key to building an effective analytics strategy.
- Customer Relationship Management (CRM): This is the heart of your sales and marketing operation. Platforms like VinSolutions, DealerSocket, or Elead are designed to manage every customer interaction, from the initial lead to the final sale and beyond. Your CRM is where you track lead response times, appointment rates, follow-up activities, and salesperson performance. A well-managed CRM is the single source of truth for your customer-facing activities.
- Dealership Management System (DMS): This is the dealership’s core operating system. Systems from providers like CDK Global or Reynolds & Reynolds are the official record-keepers for every transaction. The DMS houses all the financial data related to a vehicle sale (front and back-end gross profit), every line item on a repair order, and your complete parts inventory. It is the source of your “hard” numbers.
- Website & Digital Analytics Platforms: Your website provider (e.g., Dealer.com, Sincro) offers built-in analytics, but you must also integrate it with a universal tool like Google Analytics. These platforms track user behavior, traffic sources, conversion rates, and VDP views, giving you insight into the effectiveness of your digital storefront and marketing campaigns.
- Business Intelligence (BI) & Reporting Tools: The true power of analytics is realized when you combine data from all the sources above. BI platforms—whether they are automotive-specific solutions from companies like NCM Associates or custom-built dashboards using tools like Power BI or Tableau—aggregate data from your CRM, DMS, and Google Analytics. They present complex information in simple, visual dashboards, allowing managers to see high-level trends and drill down into specifics with just a few clicks. This is what transforms raw data into actionable business intelligence.
More Than Metrics: Cultivating a Data-Driven Culture
Investing in the best analytics tools is only half the battle. If your team doesn’t understand, trust, or use the data, your investment is wasted. Building a data-driven culture is a strategic initiative that requires a deliberate and sustained effort from the top down. It’s about changing mindsets and daily habits across every department.
It all begins with Leadership Buy-in. The dealer principal and general manager must champion the shift to analytics. They need to communicate the “why” behind the change, explaining how data will empower employees, not just monitor them. This sets the tone for the entire organization. Next comes Training and Empowerment. Don’t just show your sales team a dashboard; teach them what the KPIs mean for them personally. Show a salesperson how improving their lead response time directly impacts their appointment set rate and, ultimately, their commission check. When people understand how the data can help them succeed, they are more likely to embrace it. You must also Set Clear Goals and Incentives that are aligned with your key metrics. If appointment show rate is a priority, create a bonus structure that rewards it. If service absorption is the goal, recognize the service advisors who excel at generating customer-pay revenue. Finally, make data a central part of your daily routine through Regular Data Reviews. Discuss KPIs in your morning sales huddles. Use your BI dashboards to guide your weekly manager meetings. Make analytics the foundation of your monthly performance reviews. This consistent reinforcement embeds data into the fabric of your dealership’s operations, transforming it from a special project into simply “the way we do business.”
Conclusion: Driving into the Future with Confidence
The transition to a data-driven dealership is not about replacing the art of the sale with cold, hard numbers. It’s about augmenting the skill, experience, and intuition of your team with the power of objective insight. It’s about empowering your salespeople with the knowledge of which leads are most promising, equipping your marketing team with a clear understanding of campaign ROI, and giving your service manager the tools to optimize for profitability and customer retention. By embracing the KPIs that matter—from lead response time and closing ratios on the sales side to service absorption and customer retention in fixed-ops—you move from managing by reaction to leading with proactive, informed strategies.
The tools, from your CRM and DMS to sophisticated BI dashboards, are merely the instruments; your people and processes are the orchestra. Building a culture where data is discussed openly, used to solve problems, and leveraged to celebrate wins is the final, critical piece of the puzzle. The road ahead in automotive retail will undoubtedly feature more change and competition. Dealerships that harness the power of their own data, turning analytics into action, are not just preparing for the future; they are building it. They are the ones who will navigate the turns with greater confidence, accelerate growth more efficiently, and ultimately, win the race for market leadership and sustainable success.